Overview
| Module code | BIO-03.61-006 / BMARSYS-17.61-843 |
| Instructors | Dr. Saskia Otto, Dr. Monika Eberhard |
| Prerequisites | None |
| License | CC-BY-SA 4.0 International |
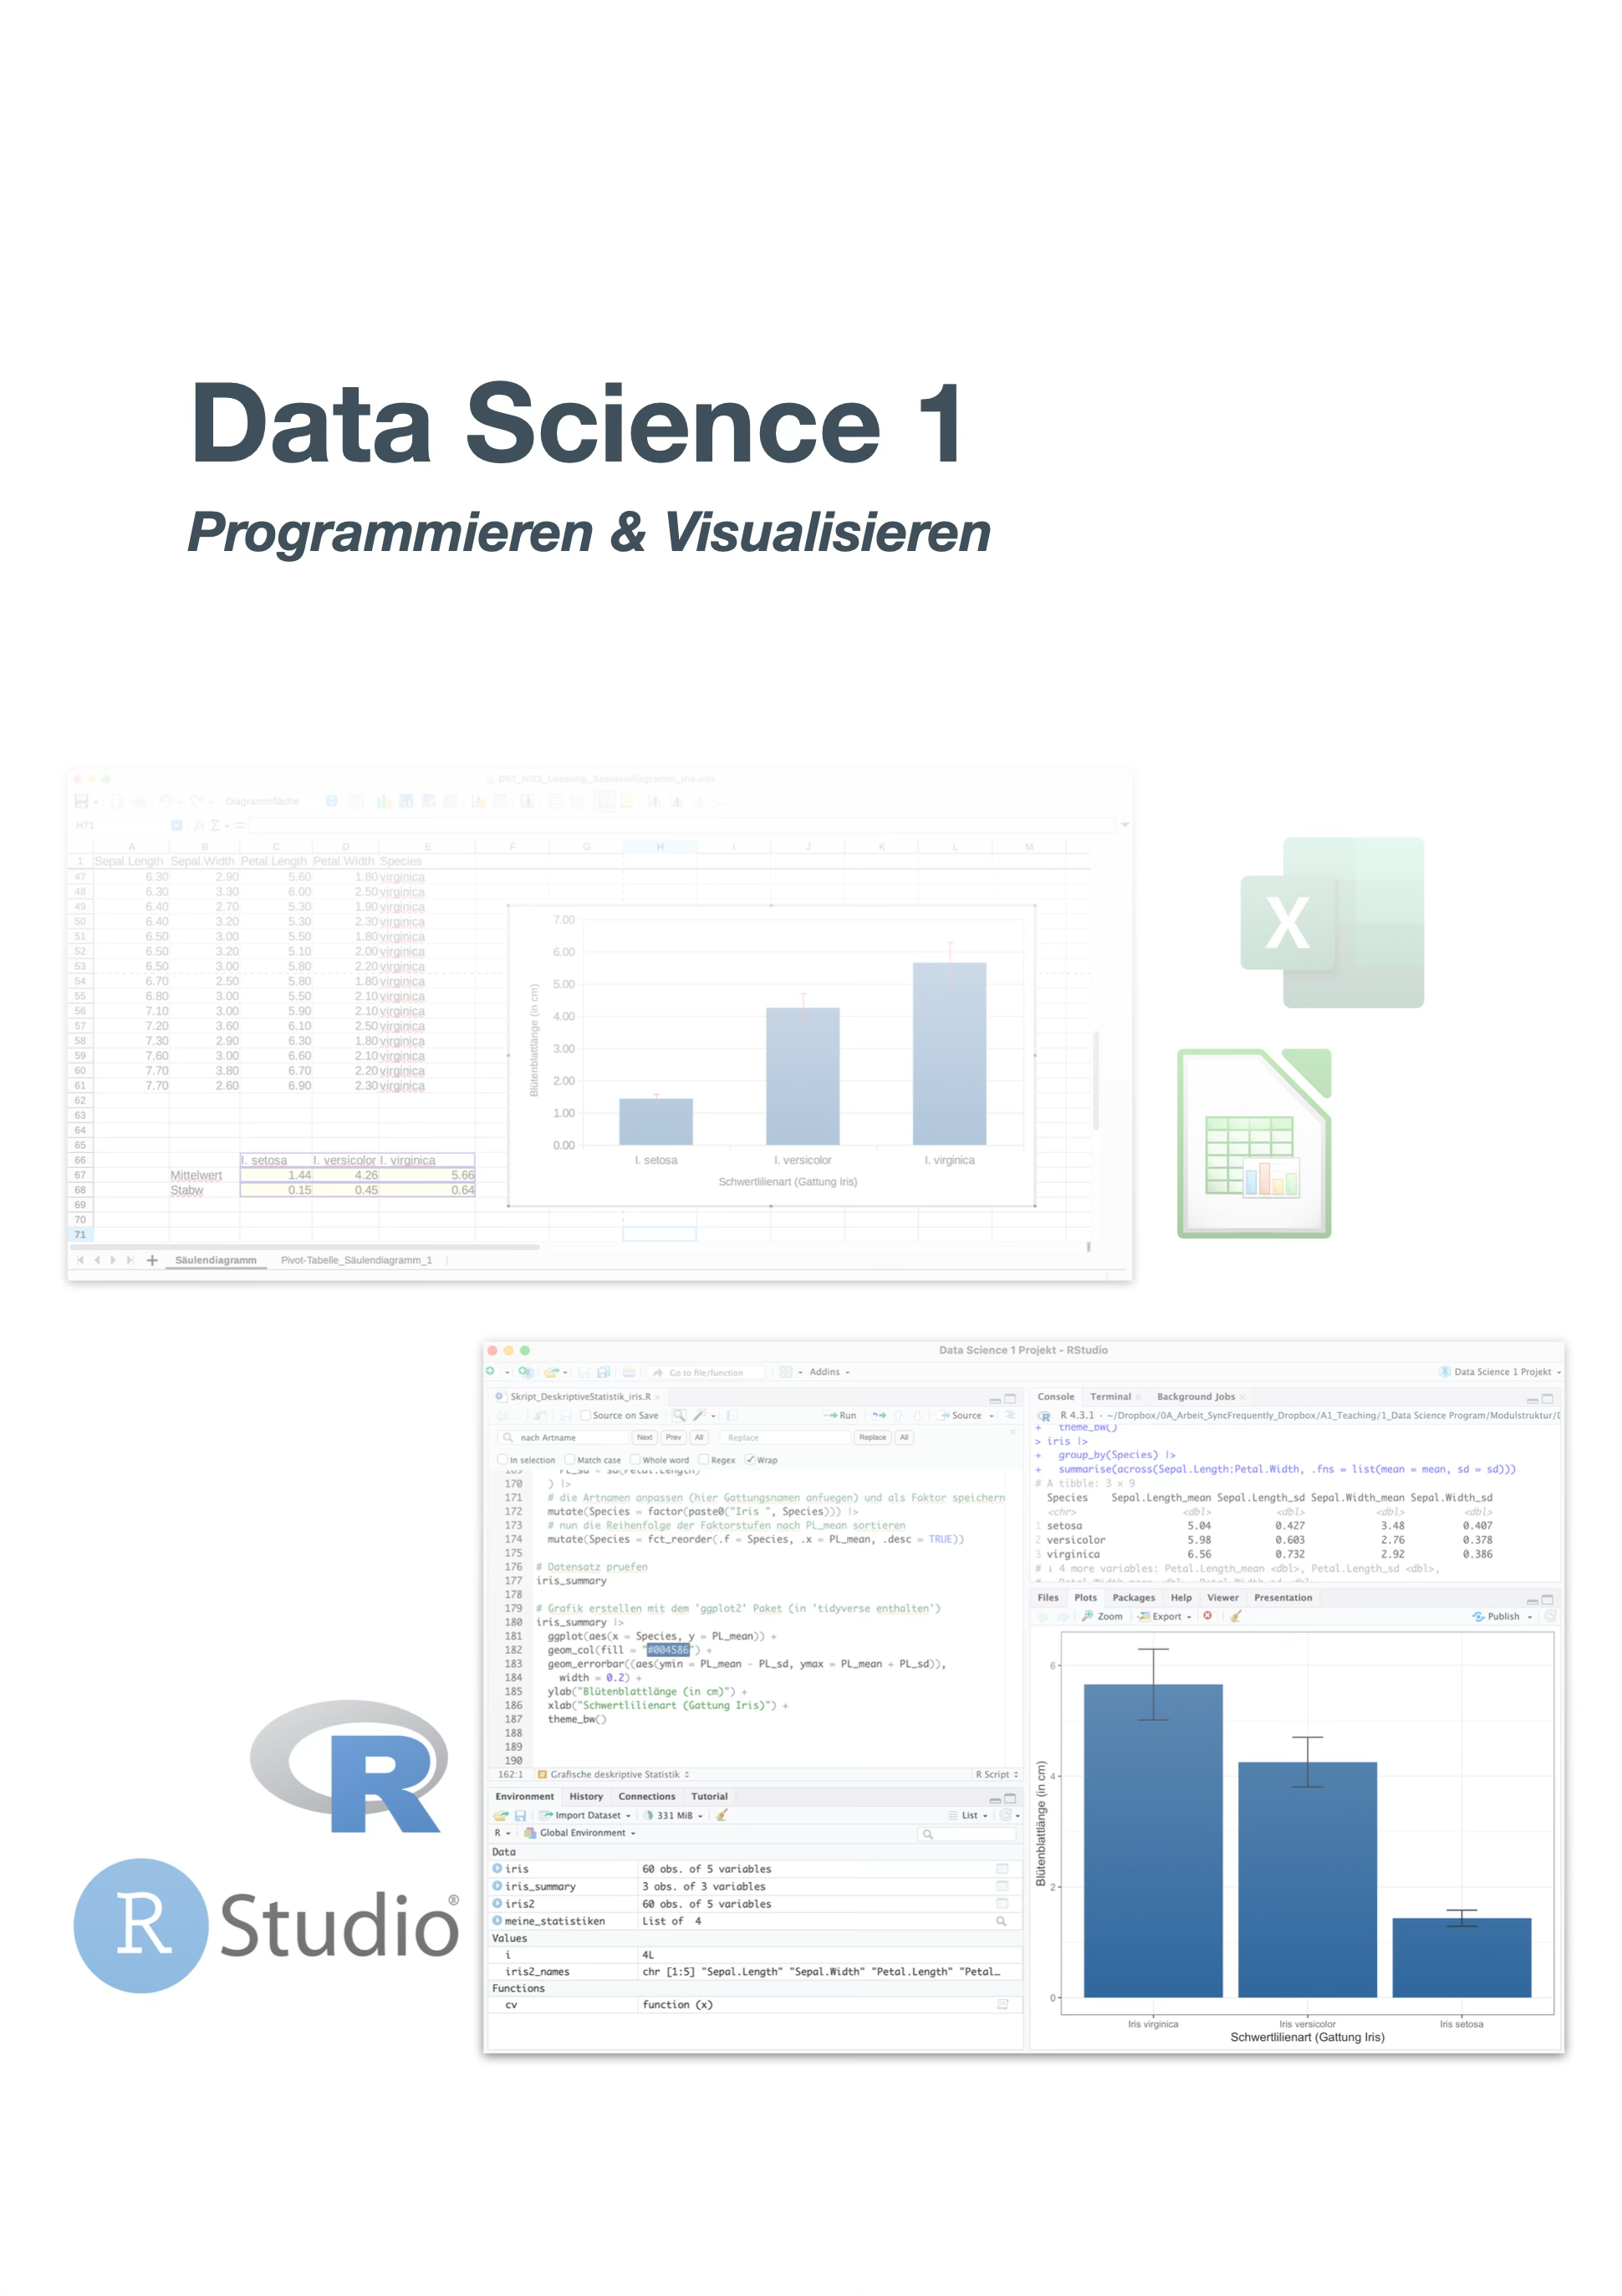
The first module in the Data Science programme is all about getting started with data. After an introduction to the spreadsheet application LibreOffice Calc, you dive into the programming language R and the development environment RStudio. You learn to import, wrangle, visualise, and describe data – from simple tables to meaningful graphics. The module is accompanied by hands-on exercises and a case study on descriptive data analysis.
Learning Objectives
After completing this module, students can:
- describe fundamental concepts of data science
- apply practical data processing skills using a spreadsheet application such as LibreOffice Calc
- confidently use the R programming language and write well-structured scripts and notebooks for data analysis and visualisation
- gain an overview of data and describe its properties
- find meaningful numerical representations for different types of datasets and manipulate them efficiently
- proficiently apply various visualisation techniques
Vorlesungsfolien (WiSe 2025/2026)
Übungsfolien zu LibreOffice Calc
| Nr. | Thema |
|---|---|
| 01 | Overview |
| 02 | Tabellen erstellen |
| 03 | Rechnen in Calc |
| 04 | Diagramme erstellen |
| 05 | Export |
Die interaktiven HTML-Vorlesungsfolien wurden von Saskia Otto mit Quarto revealjs erstellt. Beim Betrachten der Präsentation ermöglichen folgende Tastaturkombinationen unterschiedliche Anzeigemodi:
- o zeigt den Übersichtsmodus an
- w wechselt in den Breitbandmodus
- f wechselt in den Vollbildmodus
- h erlaubt das Hervorheben von Code
- ctrl (Windows) bzw. cmd (Mac) UND + / - zum rein- und rauszoomen
- p öffnet ein Pop-up Fenster für zusätzliche Informationen (funktioniert allerdings nicht bei Safari)
- mit esc kann wieder in den normalen Modus gewechselt werden.
Lizenz der Vorlesungsfolien

Diese Arbeit ist lizenziert unter einer Creative Commons Attribution-ShareAlike 4.0 International License mit Ausnahme der entliehenen und mit Quellenangabe versehenen Abbildungen.
Accompanying Learning Materials
- Moodle course: UHH MIN Login
- RStudio Server/Posit Workbench of the Department of Biology: the URL is provided via the Moodle course (login credentials are sent by email)
- RStudio Server via JupyterHub of the MIN Faculty: https://code.min.uni-hamburg.de/hub/ (access via BAN credentials)
- swirl courses: DSBswirl – interactive exercises in R (DSB-01 to DSB-04)
- Cheatsheets & Guides: Reference cards on Calc and the RStudio Server, on basic R functions and ggplot2, and on visualisation techniques
- Open Science templates: UHHformats, UHHthesis (BITTE AUSFÜHREN)
Book Recommendations
- German:
- Bärlocher, F. (1999): Biostatistik – Praktische Einführung in Konzepte und Methoden, Thieme Verlag, 206 pp.
- Eickhoff-Schachtebeck, A. & Schöbel, A. (2014): Mathematik in der Biologie, Springer Spektrum, 277 pp.
- English:
- Data Science with R
- Crawley, M.J. (2013): The R Book, 2nd edition, Wiley & Sons, West Sussex, UK, 945 pp.
- Wickham, H. & Grolemund, G. (2023): R for Data Science, 2nd edition, O’Reilly Media Inc., CA, USA. Available online at r4ds.hadley.nz
- Visualisation with ggplot2
- Wickham, H. (2016): ggplot2 – Elegant Graphics for Data Analysis, 2nd edition, Springer International Publishing, Switzerland, 260 pp.
- Kassambara, A. (2013): Guide to Create Beautiful Graphics in R, 2nd edition, STHDA, 237 pp.
- Visualisation (general)
- Kirk, A. (2019): Data Visualisation – A Handbook for Data Driven Design, 2nd edition, SAGE Publications Ltd., 312 pp.
- Berinato, S. (2019): Good Charts Workbook, HBR Press, 279 pp.
- Data Science with R