DSB Home
  • Modules
    • Module Overview

    • BSc BIO/BMARSYS
    • Data Science 1
    • Data Science 2
    • Data Science 3
  • Software
    • Programming Languages
    • R
    • Python
    • Matlab & Octave

    • Development Environments (IDEs)
    • RStudio
    • Positron
    • Visual Studio Code
    • JupyterHub

    • Notebooks
    • Jupyter Notebook
    • Quarto

    • Markup Languages
    • LaTeX & Formulas
    • Markdown

    • Version Control
    • Git & GitLab

    • Spreadsheets
    • LibreOffice Calc
  • Resources
    • Literature
    • Cheatsheets & Guides
    • BSc/MSc Thesis Guide

    • Templates & Tools
    • R Packages for UHH Templates
    • SCIproj — Research Compendia
    • R Packages swirl & DSBswirl
  • Showcases
    • Case Studies – Leaf Allometry (DS2 Summer 2023 & 2024)
    • North Sea Dashboard (iMARSYS3 Winter 2023/2024)
  • Blog
    • Student Tutorials

    • R Packages
    • cowplot
    • plotly
    • sf
    • mapview
    • oce
  • About this site
  • DE

Data Science in Biology

Teaching materials, tools, and resources for the Data Science modules in the Department of Biology

This is not an official University of Hamburg website but a supplementary teaching platform of the Department of Biology.

Our Modules

Our three-tier course series guides biology students from the foundations of programming to advanced statistical modelling methods. Module overview →

Our currently available modules:

Data Science 1

Programming & Visualisation

Go to module

Data Science 1

Data Science 2

Statistics & Experimental Design

Go to module

Data Science 2

Data Science 3

Statistical Modelling

Go to module

Data Science 3

Software

We use a range of tools for programming, data analysis, and scientific work.

R Python Matlab GNU Octave RStudio / Posit Positron VS Code Jupyter Notebook Quarto LaTeX GitLab LibreOffice Calc

Resources

Learning materials, reference cards, and tools for our courses.

Cheatsheets & Guides

Basic R Functions Basic Statistics Flowchart Diagram Types R Colors

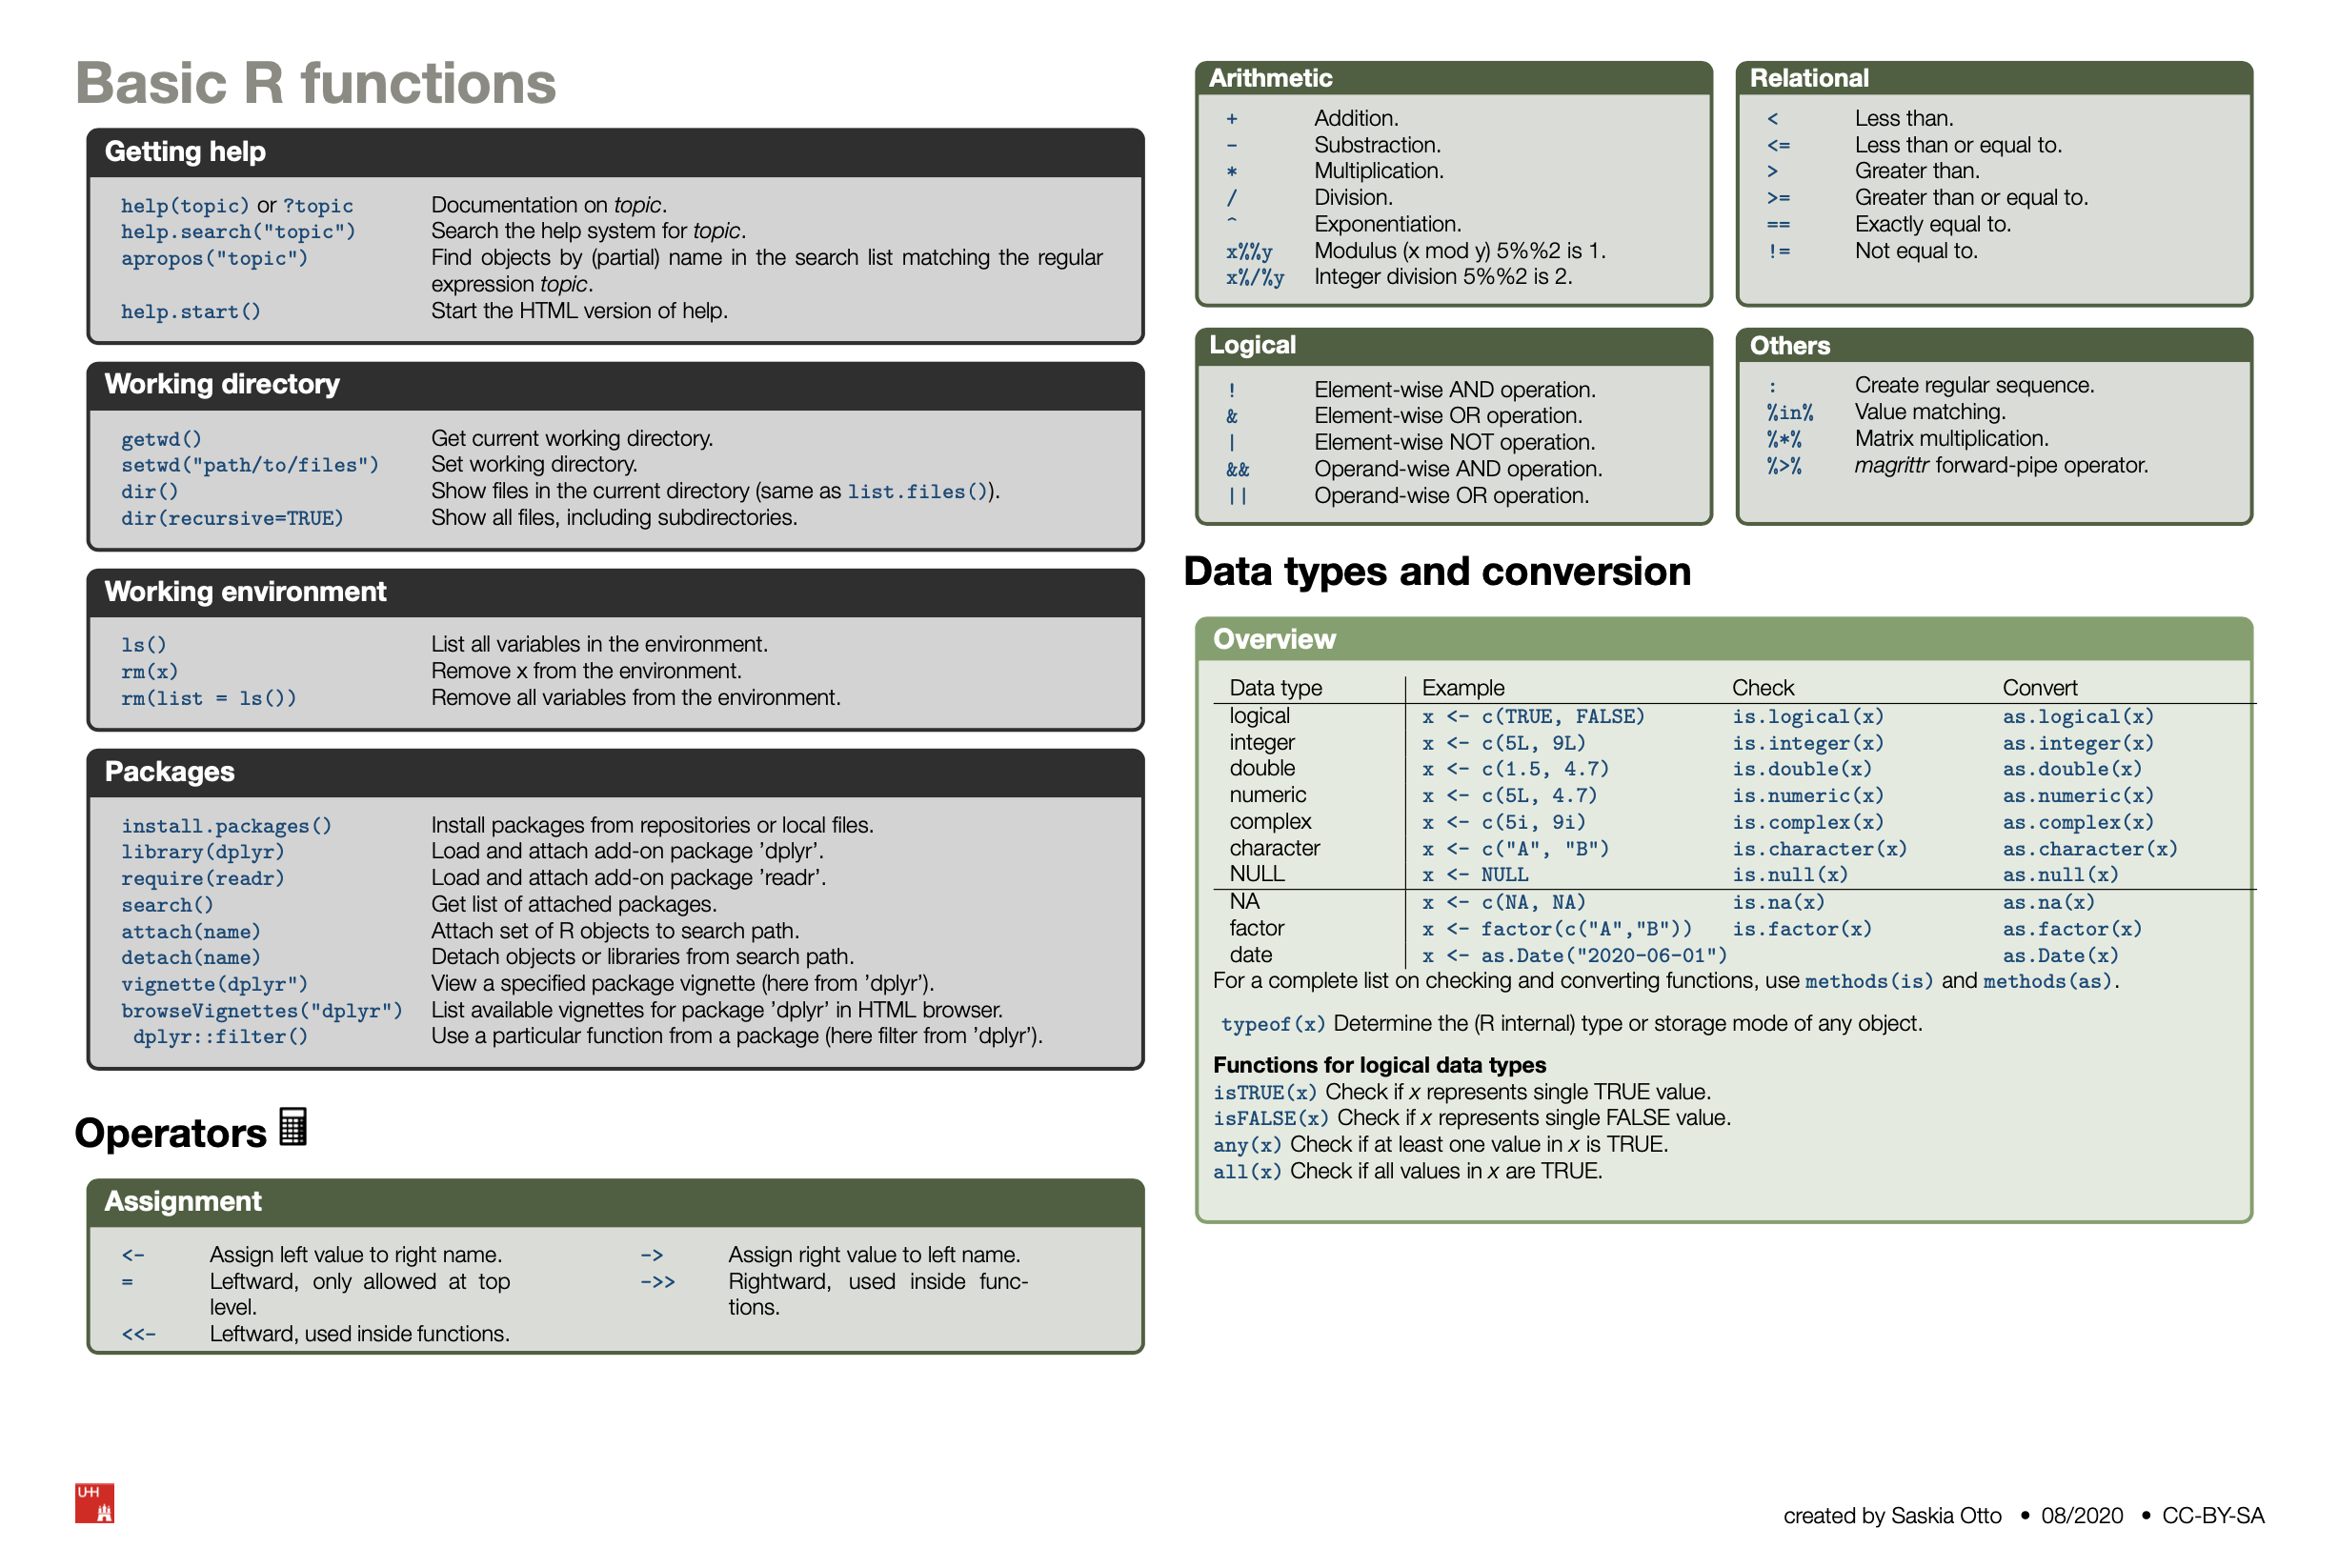
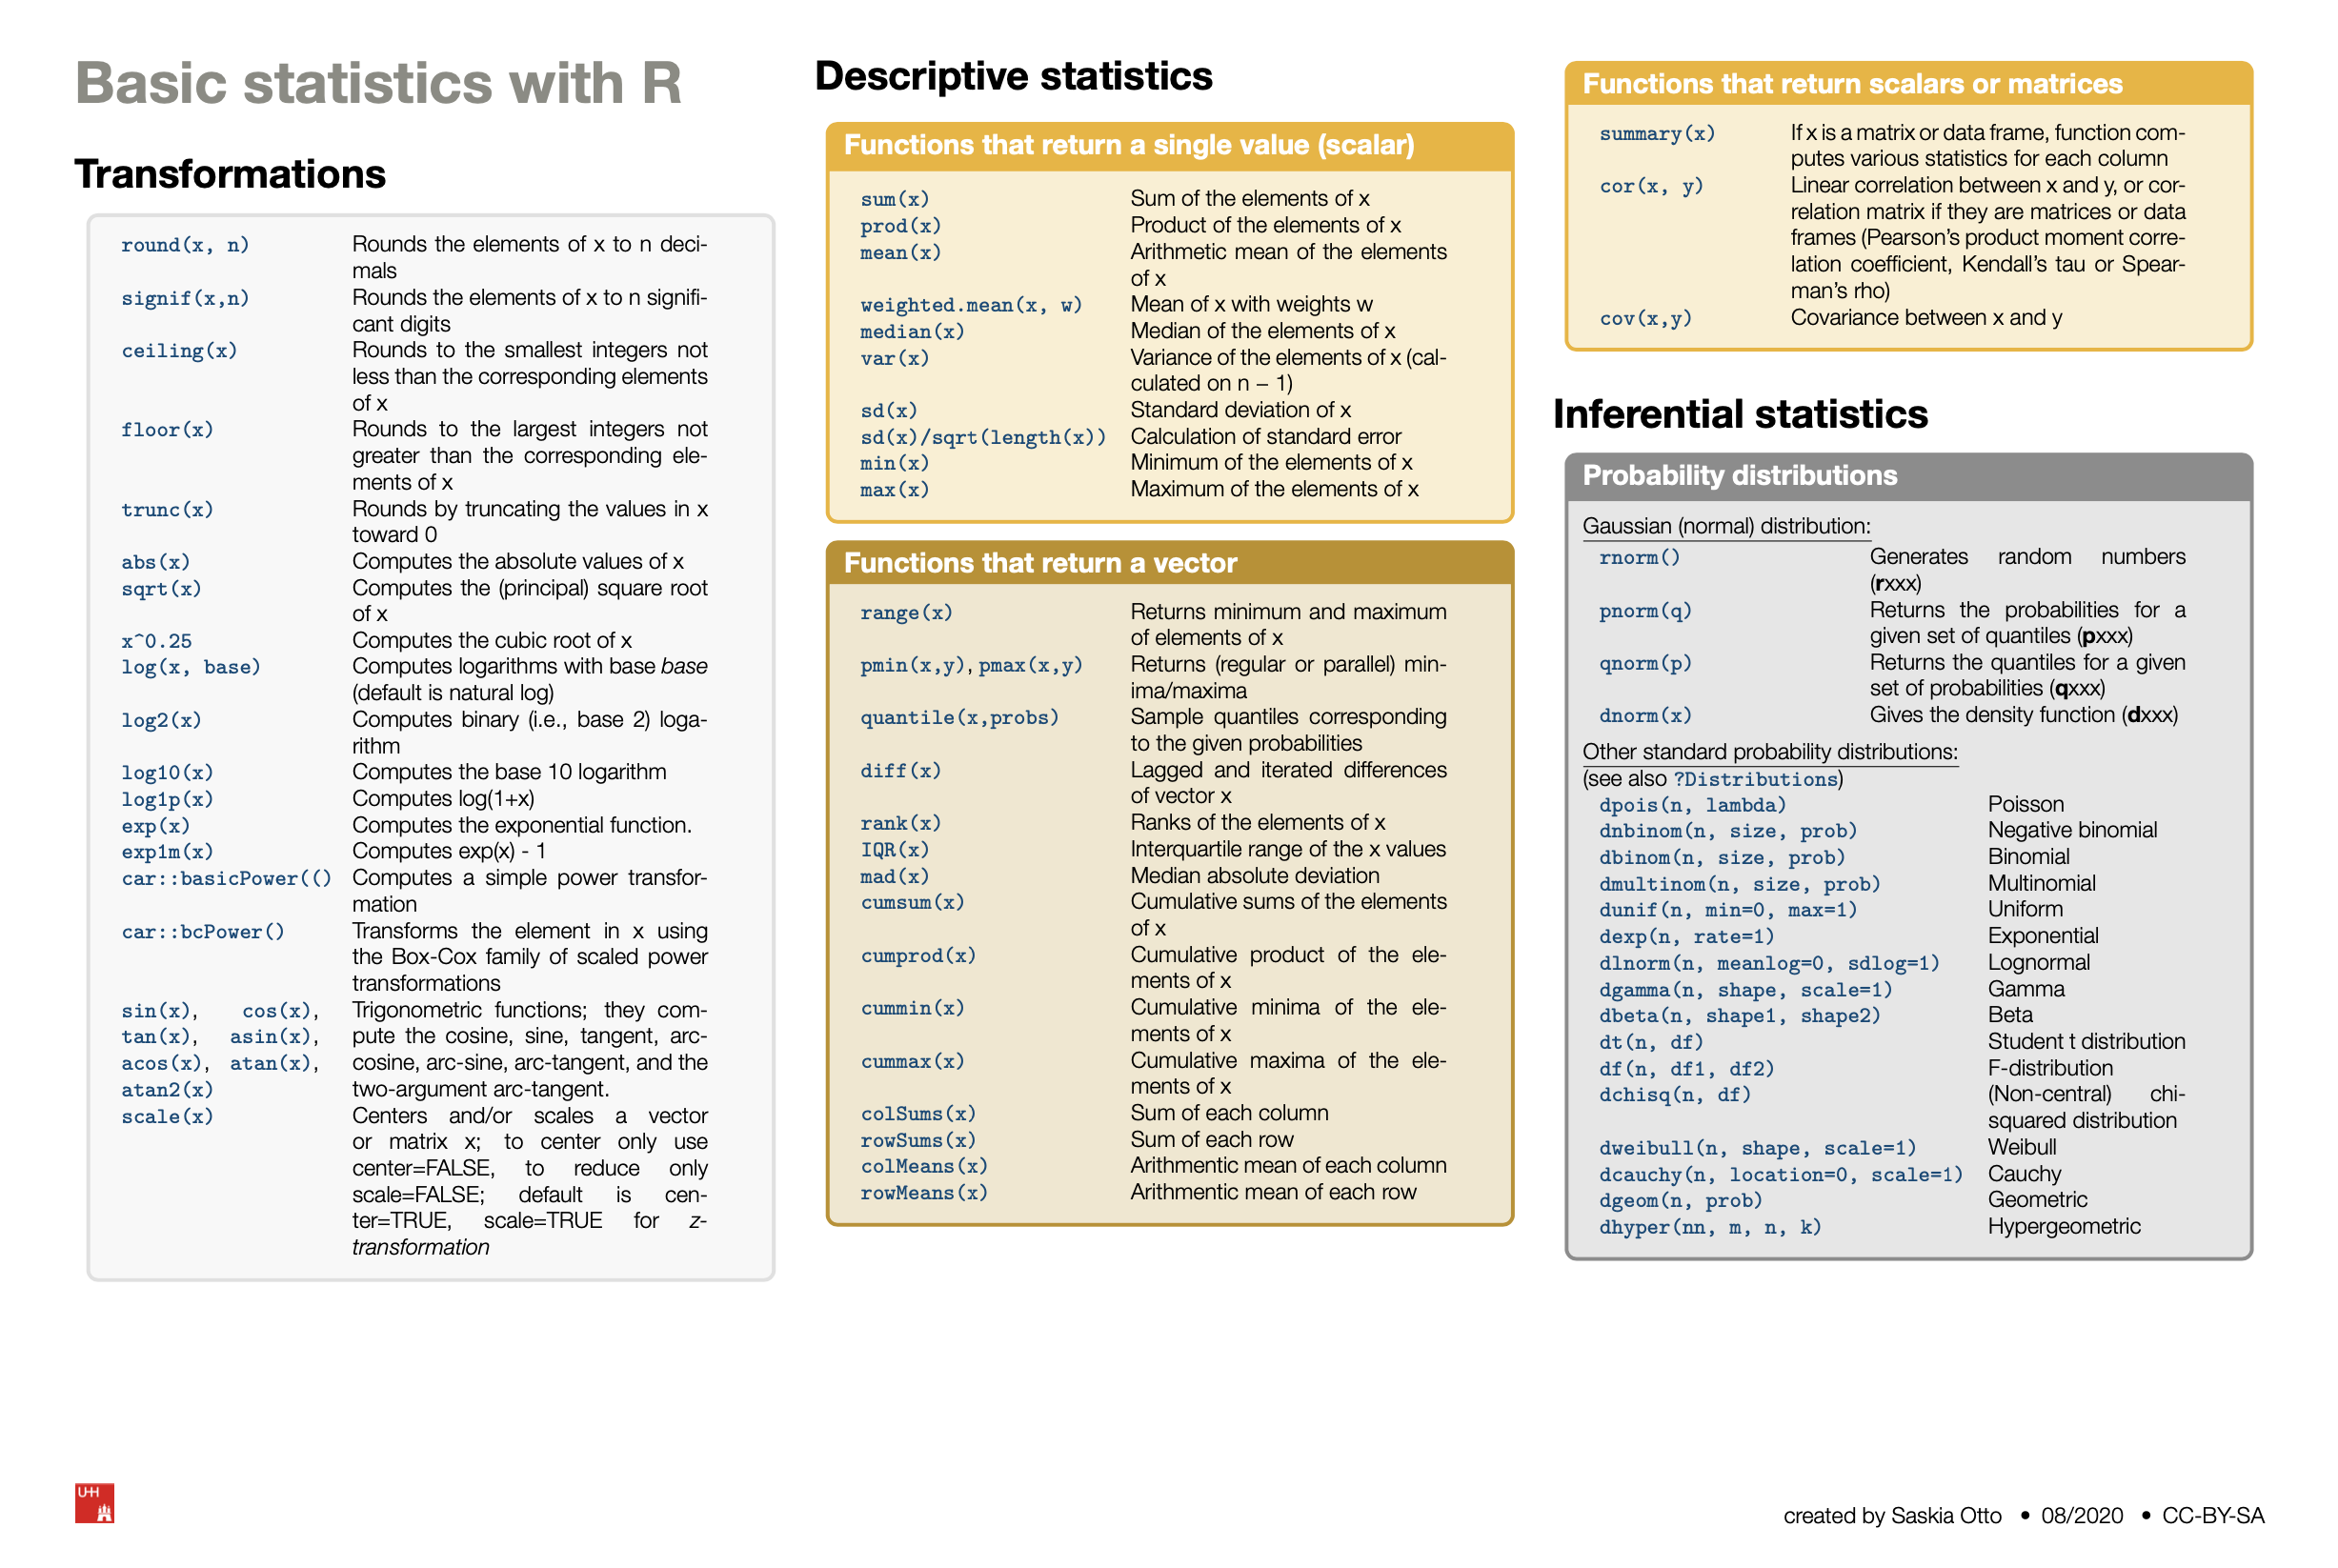
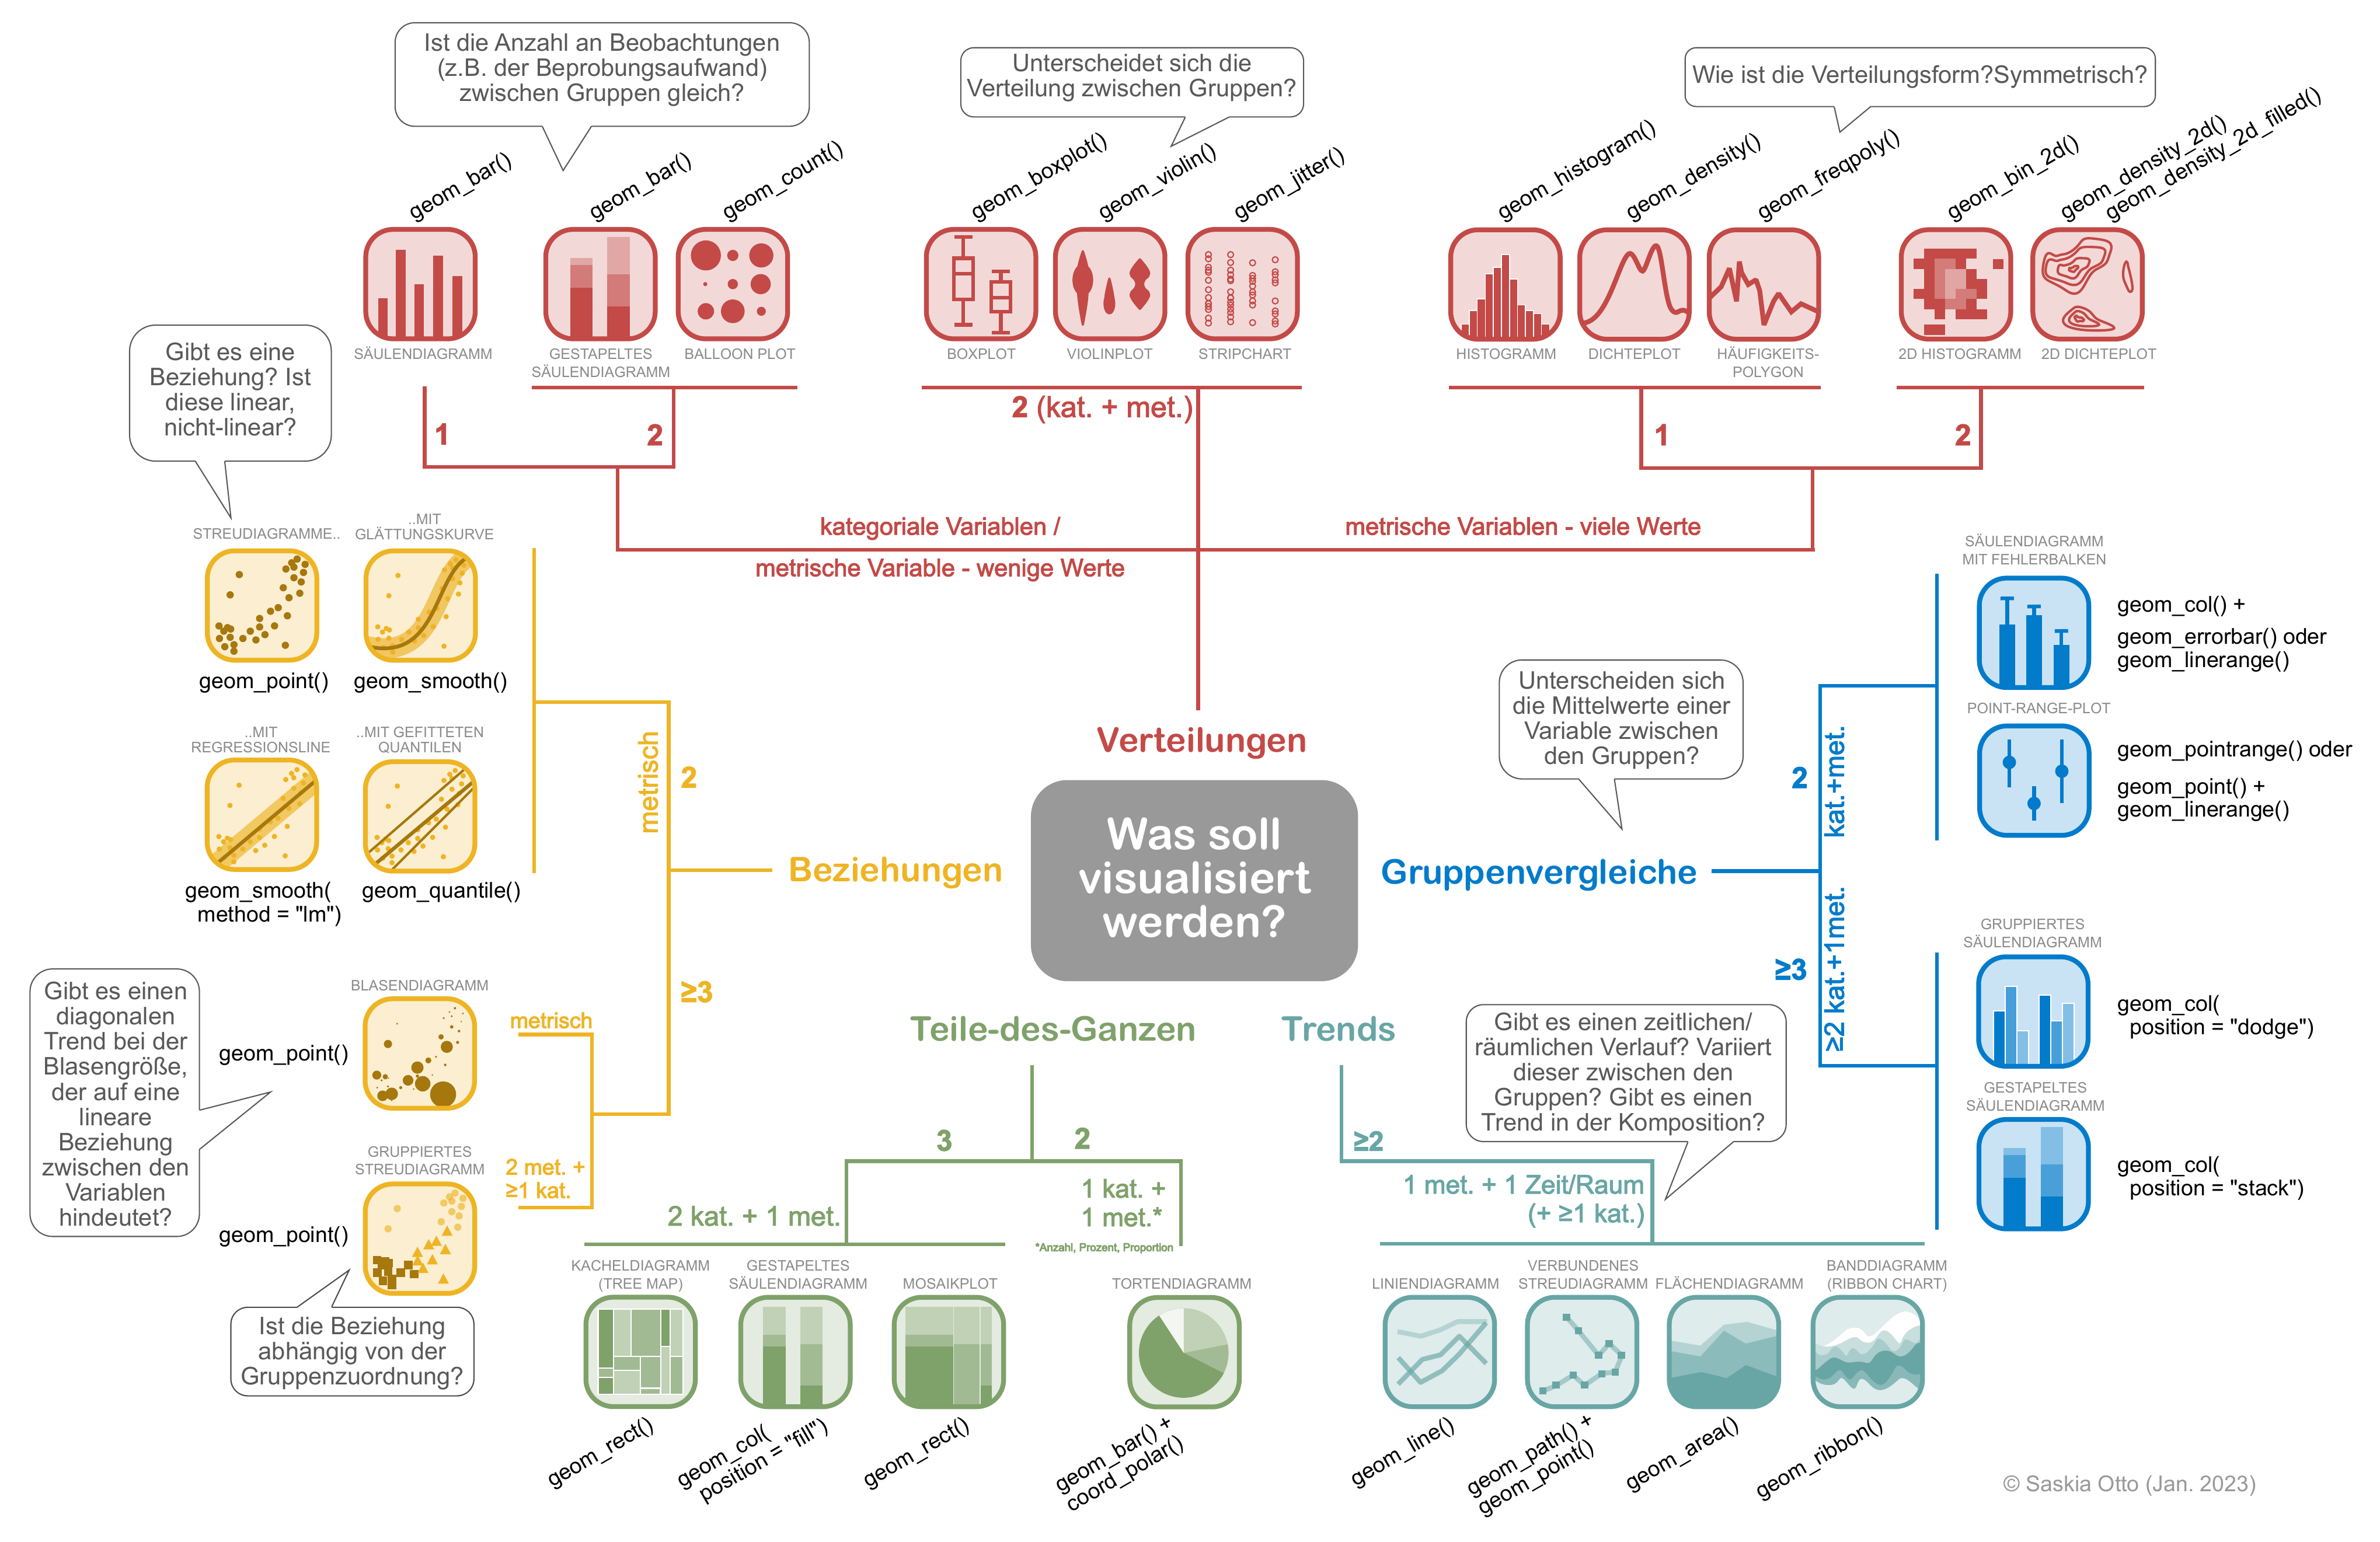
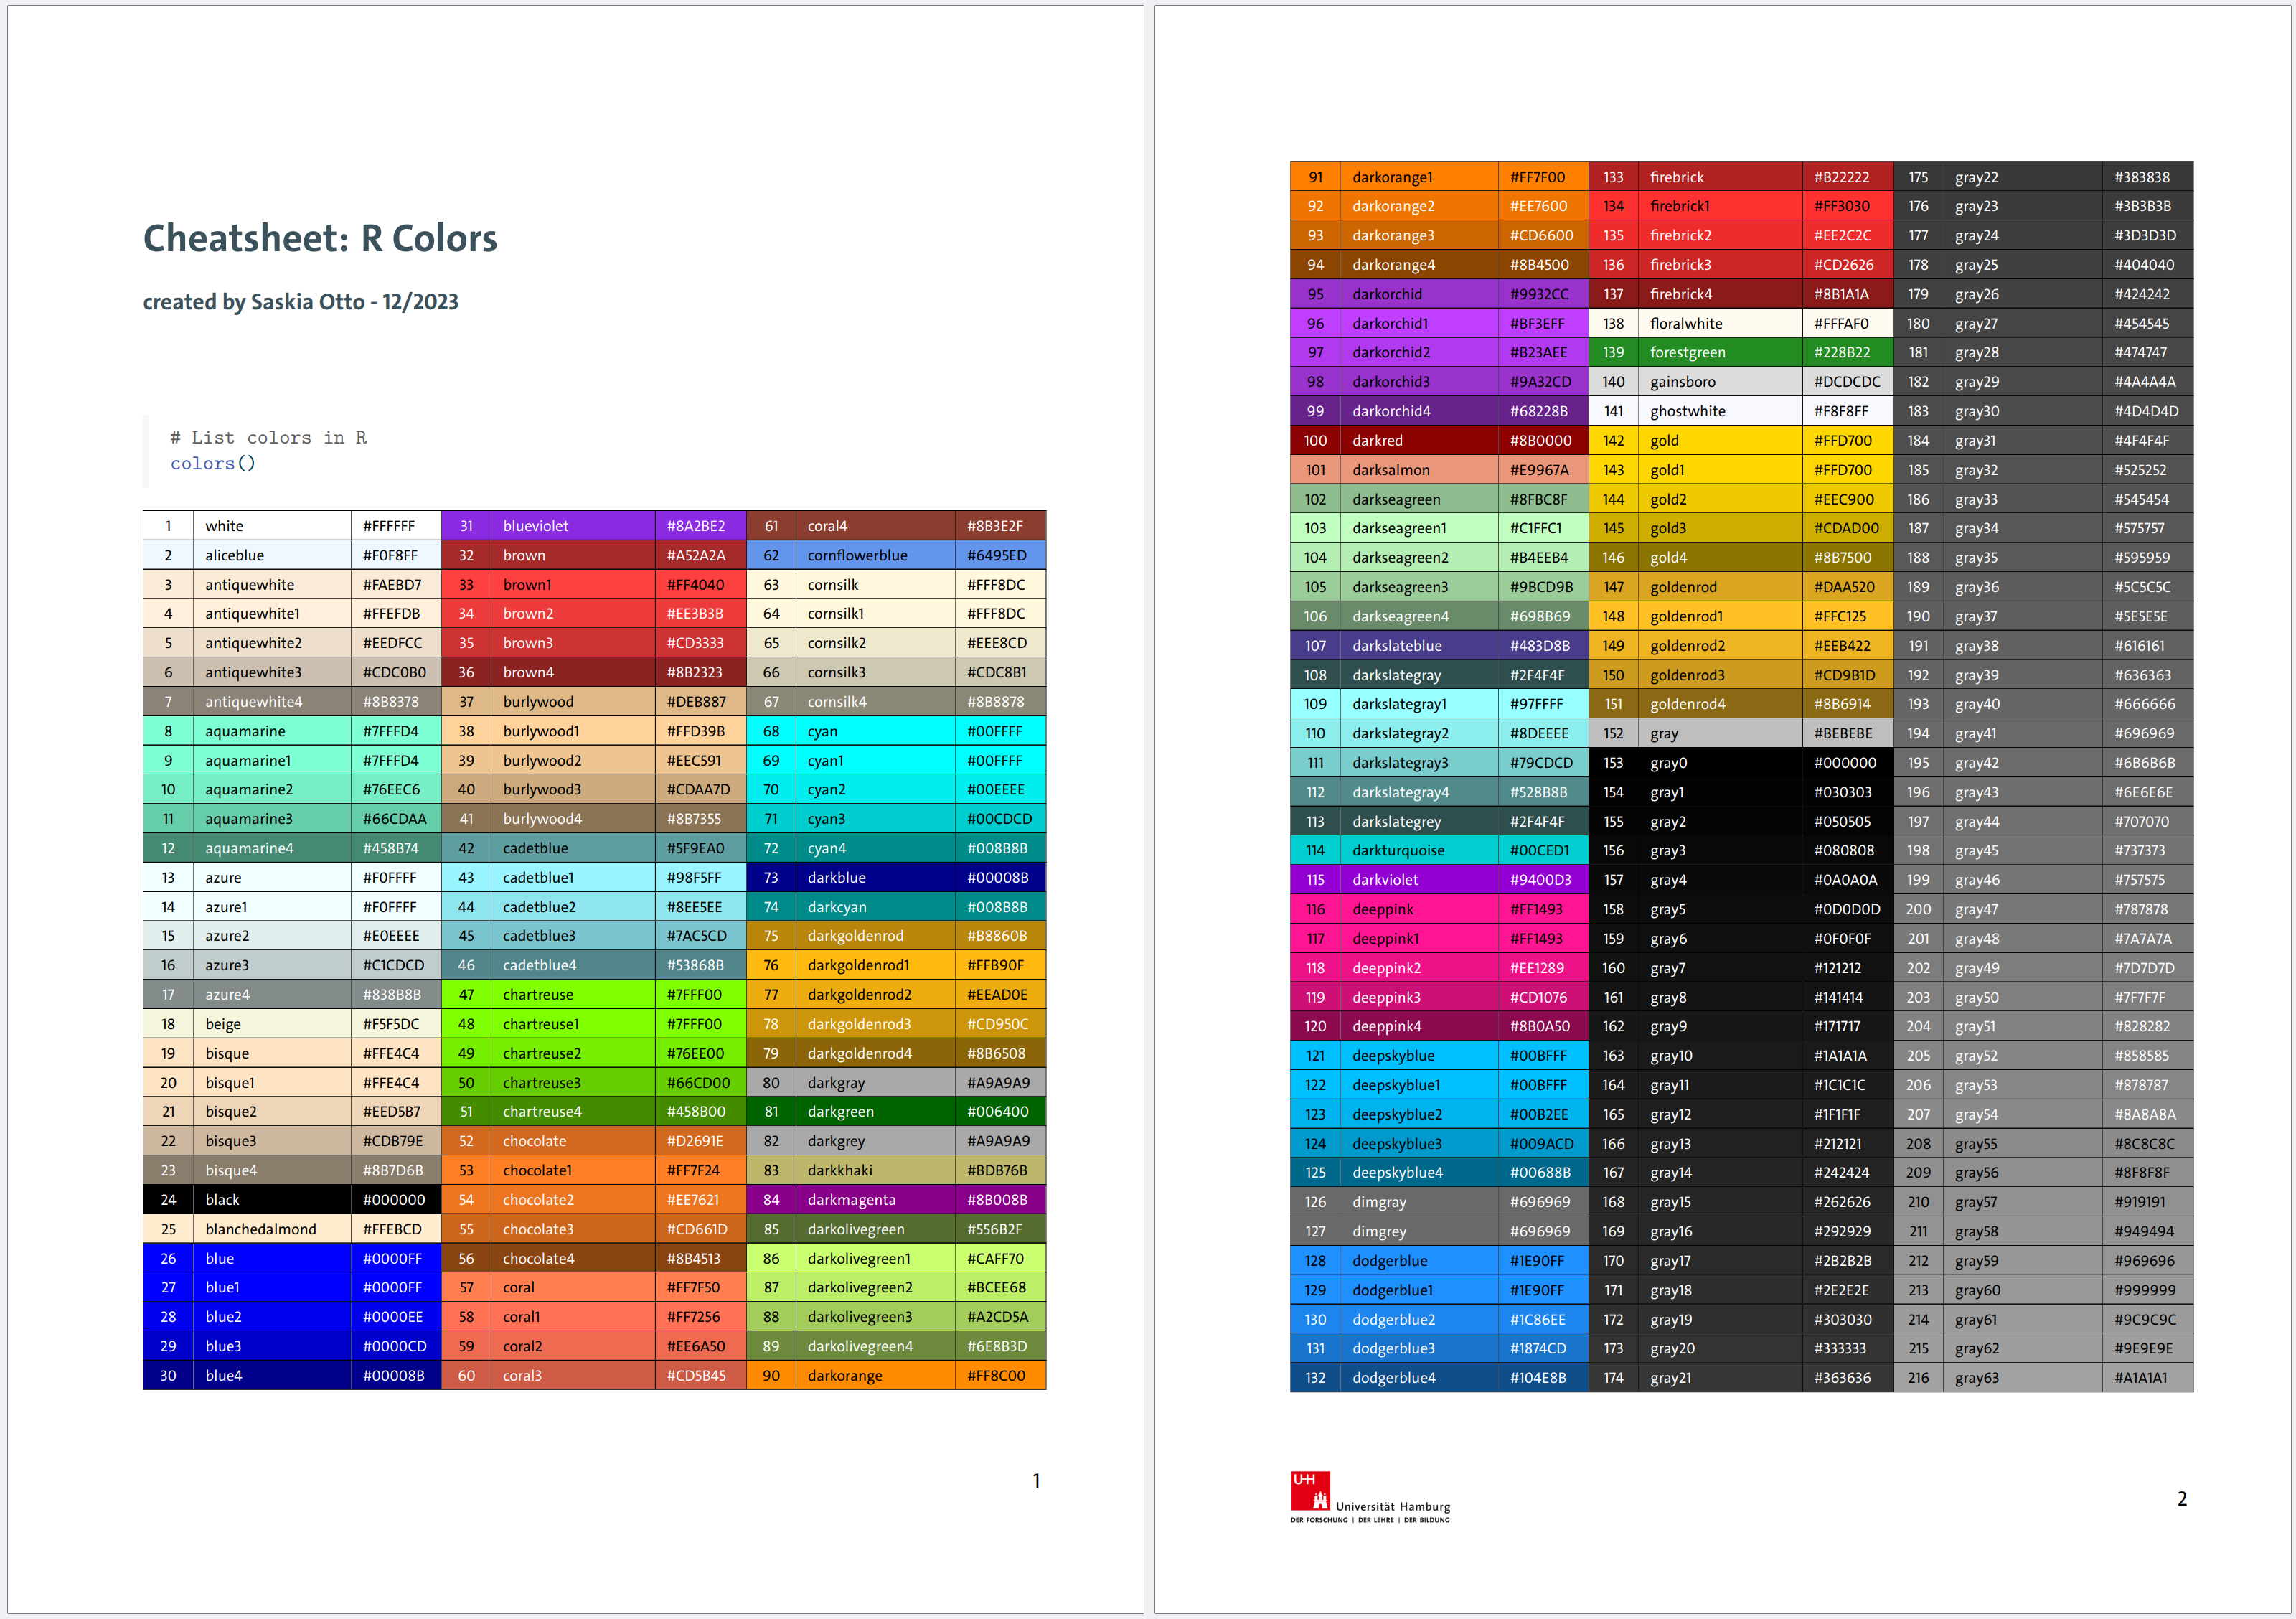
Compact reference cards on R, statistics, visualisation, and LibreOffice Calc.

All cheatsheets →

swirl-Interactive Learning

swirl in practice

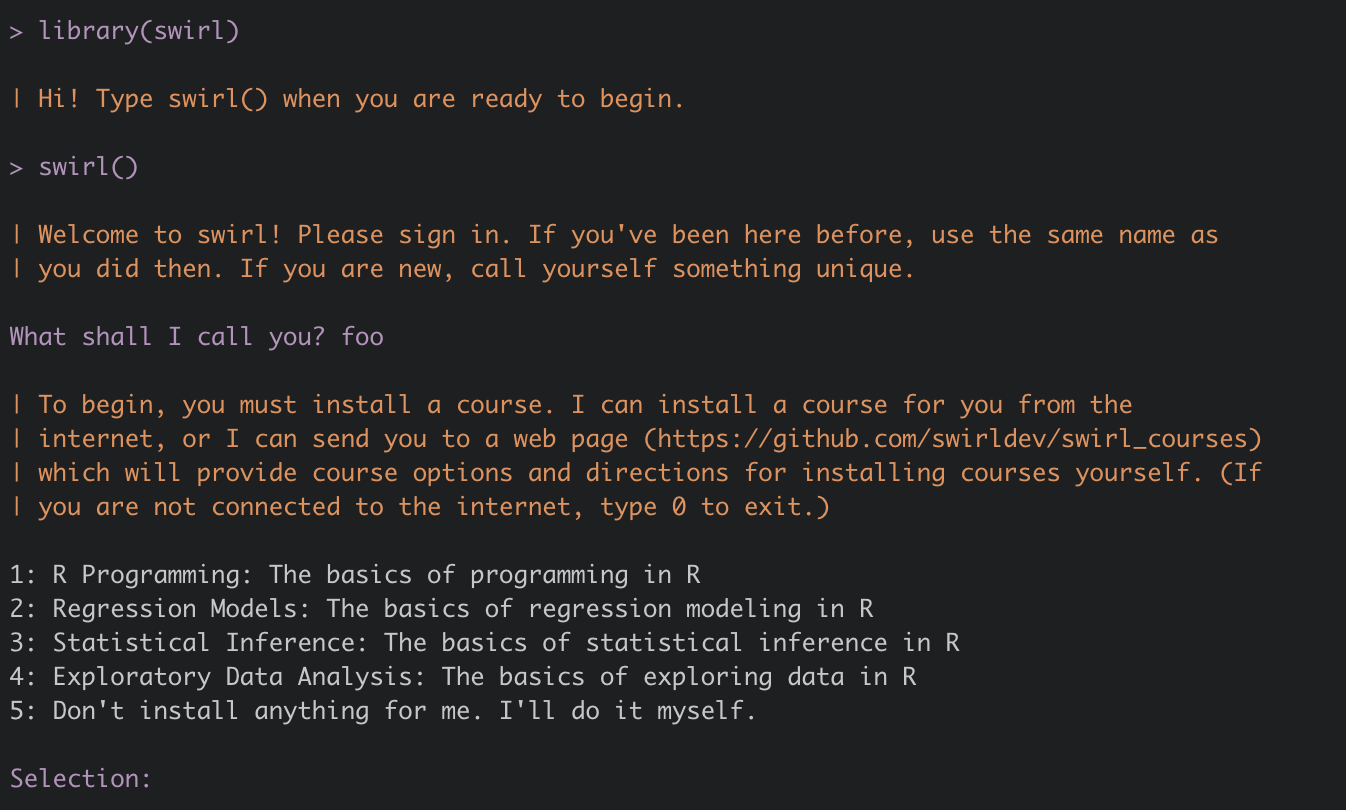
Learn R directly in the console – with immediate feedback at your own pace.

More about DSBswirl →

Templates & Tools

UHHthesis UHHformats

UHH templates for theses and documents in corporate design.

UHH templates →


SCIproj

Create reproducible research compendia with a single command.

SCIproj →

Showcases

Practical data analyses from teaching – case studies and student projects.
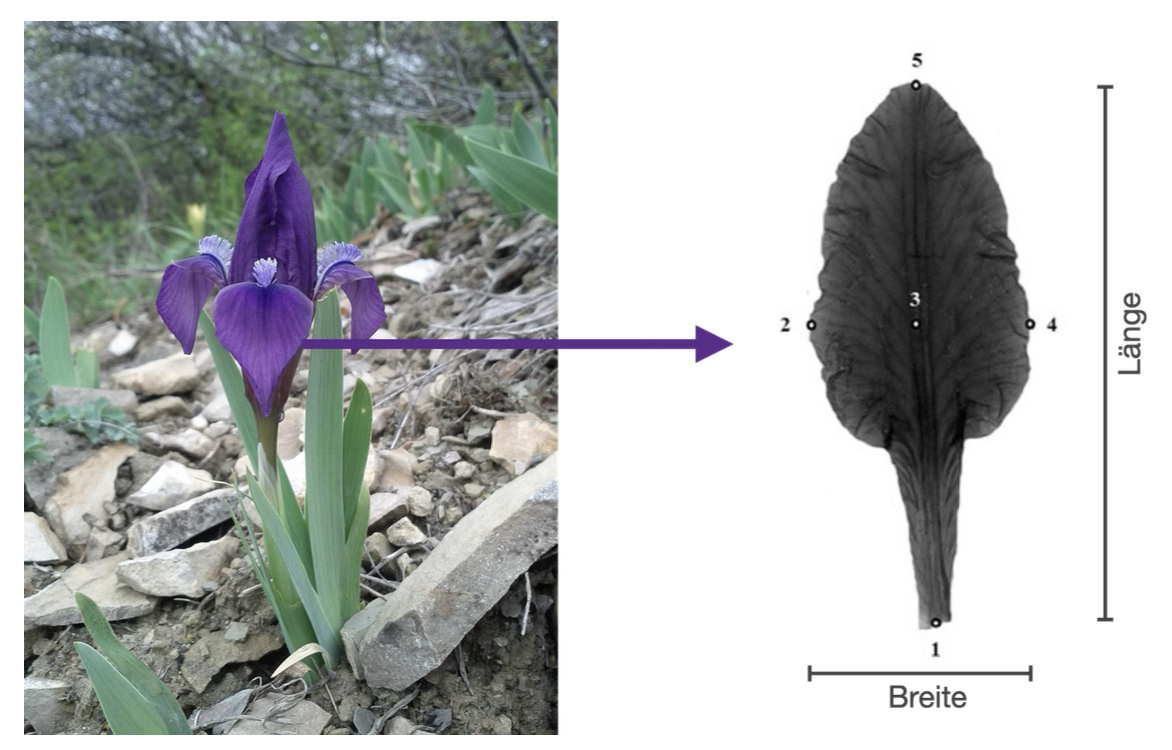
Leaf Allometry

Leaf Allometry

Case studies from DS2 (Summer 2023 & 2024): Allometric relationships in leaf data.
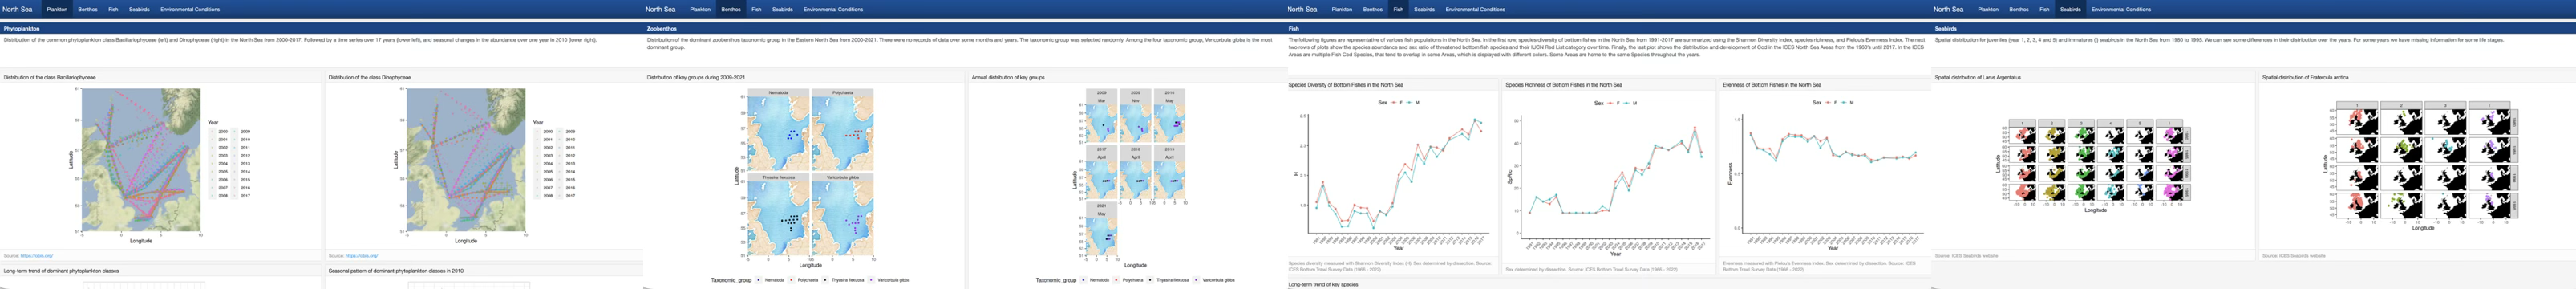
View case study

North Sea Dashboard

North Sea Dashboard

Interactive dashboard from iMARSYS3 (Winter 2023/2024): North Sea environmental data.

View dashboard

Blog & Tutorials

Student tutorials on R packages – created as coursework in our modules.

cowplot & plotly

Combine multiple plots with cowplot and create interactive graphics with plotly.

cowplot · plotly

sf & mapview

Process geodata with sf and create interactive maps with mapview.

sf · mapview

oce

Analyse and visualise oceanographic data with the oce package.

oce