![]()
R is a programming language and environment for statistical computing and graphics. R provides a wide variety of statistical and graphical techniques, such as linear and nonlinear modelling, classical statistical tests, time-series analysis, classification, clustering, and much more. One of R’s strengths is the ease with which well-designed publication-quality plots can be produced – including mathematical symbols and formulae.
R is available as free software under the terms of the GNU General Public License and runs on all major operating systems (Windows, macOS, Linux). With over 20,000 packages on CRAN, R is virtually limitlessly extensible.
R at a Glance
Video: R The most powerful and most widely used statistical software
Installation
R can be downloaded for free from the CRAN website. Choose the version for your operating system:
Click the download link, confirm the save location, and double-click the downloaded file to start the installation wizard.
The Graphical User Interface (GUI)
R’s graphical user interface is very simple. There are three main areas: the menu bar, the toolbar for quick access to functions, and the console where commands are entered.
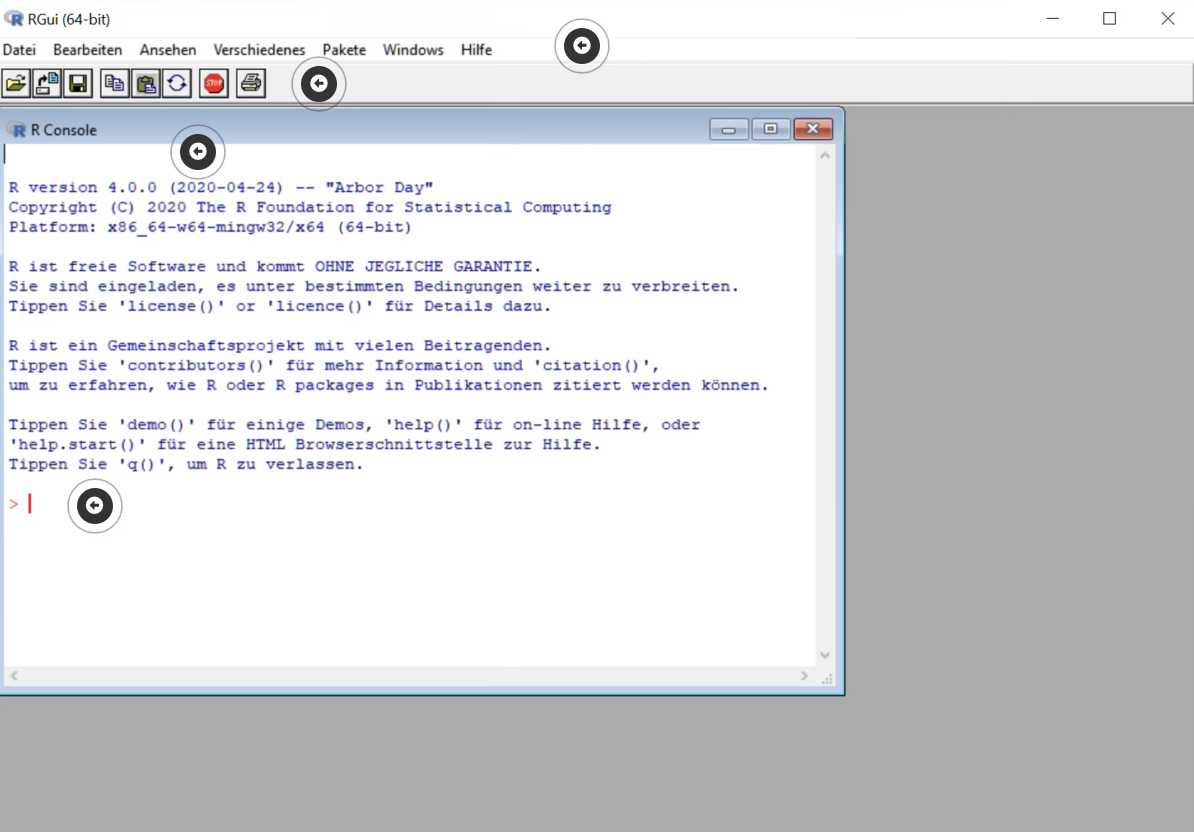
The GUI consists of the following elements:
- Element 1: Menu bar – The menu bar provides access to all R functions, such as opening and saving scripts, package management, accessing the help system, and other settings.
- Element 2: Toolbar – The toolbar below the menu bar provides quick access to frequently used functions, such as opening a new script, copy and paste, or interrupting a running computation.
- Element 3: Console – The console is the central working area of R. Results, messages, and error messages are displayed here. All output from R appears in this window.
- Element 4: Command line (input prompt
>) – The>prompt on the left side of the console indicates that R is ready to accept a new command. You type your R commands here and confirm with the Enter key.
Why R?
- Open Source – free and freely available
- Extensive package ecosystem – over 20,000 packages on CRAN
- Tidyverse – modern, consistent framework for data analysis
- Reproducible research – with R Markdown and Quarto
- Strong community – active user community worldwide
- Publication-ready graphics – full control over appearance
Key Packages for Our Courses
| Package | Description |
|---|---|
tidyverse |
Collection of packages for data manipulation and visualization |
ggplot2 |
Data visualization based on the Grammar of Graphics |
dplyr |
Data manipulation and transformation |
tidyr |
Reshaping data into tidy format |
readr |
Fast data import |
rmarkdown |
Dynamic document creation |
quarto |
Scientific publications |
Further Resources
- The R Project – Official website
- CRAN Task Views – Thematically organized package overviews
- R for Data Science (2e) – Online book by Hadley Wickham
- Lecture slides: Introduction to R – From our Data Science 1 course